Gann Single Square Swing Trading System with Gann AnglesGann Single Square Swing Trading System
This script automatically detects "squares" - geometric patterns where price movement equals time movement. When price moves the same distance as the number of bars (time), it creates powerful support/resistance levels based on Gann theory.
Key Visual Elements
• Box: The detected square pattern
• Dark Blue Line (50%): Most important trading level
• Green Lines: Profit target levels (125%, 150%)
• Red Lines: Stop loss levels (-25%, -50%)
• Colored Angle Lines: Gann angles for trend direction
• Quality Score: Blue label showing setup strength (aim for 70%+)
Simple Trading Rules
LONG Trades (Green 🟢 Square)
1. Entry: Buy when price touches the dark blue 50% line from above
2. Stop Loss: Place below the red -25% line
3. Take Profit: Exit at green 125% line (first target) or 150% line (second target)
SHORT Trades (Red 🔴 Square)
1. Entry: Sell when price touches the dark blue 50% line from below
2. Stop Loss: Place above the red -25% line
3. Take Profit: Exit at green 125% line (first target) or 150% line (second target)
Entry Checklist
✅ Square quality score > 70%
✅ Price touches 50% level (dark blue line)
✅ Volume above average (if volume filter enabled)
✅ Clear square formation visible
Alerts
The script generates automatic alerts when price reaches the 50% trading level. Enable alerts in TradingView to get notified of setups.
Bottom Line: Wait for the alert → Check quality score → Enter at 50% level → Set stop at red line → Take profit at green line.
在腳本中搜尋"stop loss"

Strategy Chameleon [theUltimator5]Have you ever looked at an indicator and wondered to yourself "Is this indicator actually profitable?" Well now you can test it out for yourself with the Strategy Chameleon!
Strategy Chameleon is a versatile, signal-agnostic trading strategy designed to adapt to any external indicator or trading system. Like a chameleon changes colors to match its environment, this strategy adapts to match any buy/sell signals you provide, making it the ultimate backtesting and automation tool for traders who want to test multiple strategies without rewriting code.
🎯 Key Features
1) Connects ANY external indicator's buy/sell signals
Works with RSI, MACD, moving averages, custom indicators, or any Pine Script output
Simply connect your indicator's signal output to the strategy inputs
2) Multiple Stop Loss Types:
Percentage-based stops
ATR (Average True Range) dynamic stops
Fixed point stops
3) Advanced Trailing Stop System:
Percentage trailing
ATR-based trailing
Fixed point trailing
4) Flexible Take Profit Options:
Risk:Reward ratio targeting
Percentage-based profits
ATR-based profits
Fixed point profits
5) Trading Direction Control
Long Only - Bull market strategies
Short Only - Bear market strategies
Both - Full market strategies
6) Time-Based Filtering
Optional trading session restrictions
Customize active trading hours
Perfect for day trading strategies
📈 How It Works
Signal Detection: The strategy monitors your connected buy/sell signals
Entry Logic: Executes trades when signals trigger during valid time periods
Risk Management: Automatically applies your chosen stop loss and take profit levels
Trailing System: Dynamically adjusts stops to lock in profits
Performance Tracking: Real-time statistics table showing win rate and performance
⚙️ Setup Instructions
0) Add indicator you want to test, then add the Strategy to your chart
Connect Your Signals:
imgur.com
Go to strategy settings → Signal Sources
1) Set "Buy Signal Source" to your indicator's buy output
2) Set "Sell Signal Source" to your indicator's sell output
3) Choose table position - This simply changes the table location on the screen
4) Set trading direction preference - Buy only? Sell only? Both directions?
imgur.com
5) Set your preferred stop loss type and level
You can set the stop loss to be either percentage based or ATR and fully configurable.
6) Enable trailing stops if desired
imgur.com
7) Configure take profit settings
8) Toggle time filter to only consider specific time windows or trading sessions.
🚀 Use Cases
Test various indicators to determine feasibility and/or profitability.
Compare different signal sources quickly
Validate trading ideas with consistent risk management
Portfolio Management
Apply uniform risk management across different strategies
Standardize stop loss and take profit rules
Monitor performance consistently
Automation Ready
Built-in alert conditions for automated trading
Compatible with trading bots and webhooks
Easy integration with external systems
⚠️ Important Notes
This strategy requires external signals to function
Default settings use 10% of equity per trade
Pyramiding is disabled (one position at a time)
Strategy calculates on bar close, not every tick
🔗 Integration Examples
Works perfectly with:
RSI strategies (connect RSI > 70 for sells, RSI < 30 for buys)
Moving average crossovers
MACD signal line crosses
Bollinger Band strategies
Custom oscillators and indicators
Multi-timeframe strategies
📋 Default Settings
Position Size: 10% of equity
Stop Loss: 2% percentage-based
Trailing Stop: 1.5% percentage-based (enabled)
Take Profit: Disabled (optional)
Trade Direction: Both long and short
Time Filter: Disabled

All SMAs Bullish/Bearish Screener (Enhanced)All SMAs Bullish/Bearish Screener Enhanced: Uncover High-Conviction Trend Alignments with Confidence
Description:
Are you ready to elevate your trading from mere guesswork to precise, data-driven decisions? The "All SMAs Bullish/Bearish Screener Enhanced" is not just another indicator; it's a sophisticated, yet user-friendly, trend-following powerhouse designed to cut through market noise and pinpoint high-probability trading opportunities. Built on the foundational strength of comprehensive Moving Average confluence and fortified with critical confirmation signals from Momentum, Volume, and Relative Strength, this script empowers you to identify truly robust trends and manage your trades with unparalleled clarity.
The Power of Multi-Factor Confluence: Beyond Simple Averages
In the unpredictable world of financial markets, true strength or weakness is rarely an isolated event. It's the harmonious alignment of multiple technical factors that signals a high-conviction move. While our original "All SMAs Bullish/Bearish Screener" intelligently identified stocks where price was consistently above or below a full spectrum of Simple Moving Averages (5, 10, 20, 50, 100, 200), this Enhanced version takes it a crucial step further.
We've integrated a powerful three-pronged confirmation system to filter out weaker signals and highlight only the most compelling setups:
Momentum (Rate of Change - ROC): A strong trend isn't just about price direction; it's about the speed and intensity of that movement. Positive momentum confirms that buyers are still aggressively pushing price higher (for bullish signals), while negative momentum validates selling pressure (for bearish signals).
Volume: No trend is truly trustworthy without the backing of smart money. Above-average volume accompanying an "All SMAs" alignment signifies strong institutional participation and conviction behind the move. It separates genuine trend starts from speculative whims.
Relative Strength Index (RSI): This versatile oscillator ensures the trend isn't just "there," but that it's developing healthily. We use RSI to confirm a bullish bias (above 50) or a bearish bias (below 50), adding another layer of confidence to the direction.
When the price aligns above ALL six critical SMAs, and is simultaneously confirmed by robust positive momentum, healthy volume, and a bullish RSI bias, you have an exceptionally strong "STRONGLY BULLISH" signal. This confluence often precedes sustained upward moves, signaling prime accumulation phases. Conversely, a "STRONGLY BEARISH" signal, where price is below ALL SMAs with negative momentum, confirming volume, and a bearish RSI bias, indicates powerful distribution and potential for significant downside.
How to Use This Enhanced Screener:
Add to Chart: Go to TradingView's Pine Editor, paste the script, and click "Add to Chart."
Customize Parameters: Fine-tune the lengths of your SMAs, RSI, Momentum, and Volume averages via the indicator's settings. Experiment to find what best suits your trading style and the assets you trade.
Choose Your Timeframe Wisely:
Daily (1D) and 4-Hour (240 min) are highly recommended. These timeframes cut through intraday noise and provide more reliable, actionable signals for swing and position trading.
Shorter timeframes (e.g., 15min, 60min) can be used by advanced day traders for very short-term entries, but be aware of increased volatility and noise.
Visual Confirmation:
Green/Red Triangles: Appear on your chart, indicating confirmed bullish or bearish signals.
Background Color: The chart background will subtly turn lime green for "STRONGLY BULLISH" and red for "STRONGLY BEARISH" conditions.
On-Chart Status Table: A clear table displays the current signal status ("STRONGLY BULLISH/BEARISH," or "SMAs Mixed") for immediate feedback.
Set Up Alerts (Your Primary Screener Tool): This is the game-changer! Create custom alerts on TradingView based on the "Confirmed Bullish Trade" and "Confirmed Bearish Trade" conditions. Receive instant notifications (email, pop-up, mobile) for any stock in your watchlist that meets these stringent criteria. This allows you to scan the entire market effortlessly and act decisively.
Strategic Stop-Loss Placement: The Trader's Lifeline
Even the most robust signals can fail. Protecting your capital is paramount. For this trend-following strategy, your stop-loss should be placed where the underlying trend structure is broken.
For a "STRONGLY BULLISH" Trade: Place your stop-loss just below the most recent significant swing low (higher low). This is the last point where buyers stepped in to support the price. If price breaks below this, your bullish thesis is invalidated.
For a "STRONGLY BEARISH" Trade: Place your stop-loss just above the most recent significant swing high (lower high). If price breaks above this, your bearish thesis is invalidated.
Alternatively, consider placing your stop-loss just below the 20-period SMA (for bullish trades) or above the 20-period SMA (for bearish trades). A significant close beyond this intermediate-term average often indicates a critical shift in momentum. Always ensure your chosen stop-loss adheres to your pre-defined risk per trade (e.g., 1-2% of capital).
Disciplined Profit Booking: Maximizing Gains
Just as important as knowing when you're wrong is knowing when to take profits.
Trailing Stop-Loss: As your trade moves into profit, trail your stop-loss upwards (for longs) or downwards (for shorts). You can trail it using:
Previous Swing Lows/Highs: Move your stop to just below each new higher low (for longs) or just above each new lower high (for shorts).
A Moving Average (e.g., 10-period or 20-period SMA): If price closes below your chosen trailing SMA, exit. This allows you to ride the trend while protecting accumulated profits.
Target Levels: Identify potential resistance levels (for longs) or support levels (for shorts) using pivot points, previous highs/lows, or Fibonacci extensions. Consider taking partial profits at these levels and letting the rest run with a trailing stop.
Loss of Confluence: If the "STRONGLY BULLISH/BEARISH" condition ceases to be met (e.g., RSI crosses below 50, or volume drops significantly), this can be a signal to reduce or exit your position, even if your stop-loss hasn't been hit.
The "All SMAs Bullish/Bearish Screener Enhanced" is your comprehensive partner in navigating the markets. By combining robust trend identification with critical confirmation signals and disciplined risk management, you're equipped to make smarter, more confident trading decisions. Add it to your favorites and unlock a new level of precision in your trading journey!
#PineScript #TradingView #SMA #MovingAverage #TrendFollowing #StockScreener #TechnicalAnalysis #Bullish #Bearish #QQQ #Momentum #Volume #RSI #SPY #TradingStrategy #Enhanced #Signals #Analysis #DayTrading #SwingTrading

Risk and Position Sizing📏 Why Position Size Should Be Based on Risk?
Let’s say you are ready to lose 1,000 in a trade. Based on your stop loss level, you can calculate how many shares (or quantity) to buy, so that if the stop hits, you only lose that ₹1,000.
This is called risk-based position sizing. It makes your trade size dynamic — small when SL is wide, bigger when SL is tight. No more random position sizes — just systematic.
Portfolio size is multiplied by the selected risk % to get money risk per trade.
This amount is then used to calculate how many shares can be bought for the given stop-loss.
So chose your portfolio size in settings. Default Portfolio size is 1,00,000 .
You can select your risk % per portfolio in the settings — for example:
0.25% for conservative style
0.5% to 1% for balanced traders
1.25% or 1.5% for aggressive ones (not recommended for beginners)
This script will automatically calculate how much quantity you should buy, for each stop-loss scenario.
📈 Progressive & Inverse-Progressive Risk Styles
Some traders follow progressive position sizing — they start with small risk when the trend is just starting, and increase the risk % as the trend confirms.
Others follow inverse-progressive sizing — they take high risk at early stages of a bull market, and reduce risk as the trend matures (when upside becomes limited).
📌 This script allows you to manually control the risk % in settings, so you can adjust it based on your trading phase and style.
📋 Three SL Scenarios – Choose What Matches Your Style
The table shows three different stop-loss conditions, and for each one it calculates:
Today’s Low – tightest stop loss
Yesterday’s Low – slightly safer, ideal for short-term swing trades
EMA Stop (configurable) – gives more breathing room.
You can visually compare all 3 in the table and choose whichever fits your strategy and comfort.
Also, you can customize:
Theme: dark or light
Font size
Table position (upper/lower corners)
🧠 Designed for traders who take risk management seriously.
Let this script handle the math. You focus on execution.
Happy Trading!
– LensOfChartist

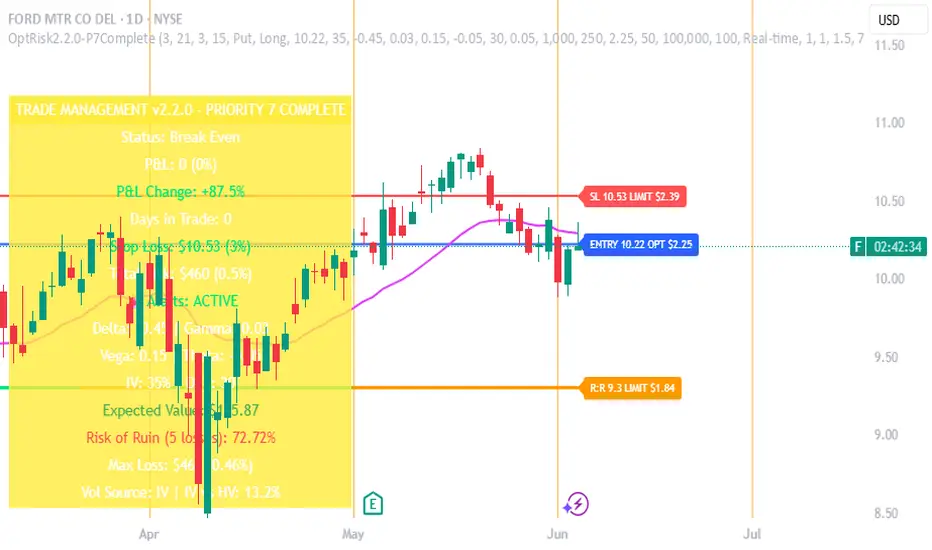
Options Risk Manager v2.2.0 - Priority 7 CompleteScript Description for TradingView Publication
Options Risk Manager v2.2.0 - Priority 7 Complete
What does this script do?
Options Risk Manager v2.2.0 is a comprehensive position management system designed specifically for options traders. The indicator calculates precise stop loss levels, risk/reward targets, and position sizing based on user-defined risk parameters. It provides real-time profit/loss tracking, options Greeks monitoring, and automated alert systems for critical price levels.
The script displays entry points, stop losses, and profit targets directly on the chart while continuously calculating position metrics including dollar risk, account exposure, and probability of success. Version 2.2.0 introduces Priority 7 advanced alerts with dynamic risk warnings and multi-condition notifications.
How does it do it?
The script performs several key calculations:
1. Risk-Based Stop Loss Calculation - Determines stop loss levels based on percentage of entry price, automatically adjusting for calls versus puts. Put positions place stops above entry, while calls place stops below.
2. Position Sizing Algorithm - Calculates optimal contract quantities using account size, risk
percentage, and stop distance to ensure consistent risk per trade regardless of underlying price.
3. Options-Specific P&L Tracking - Incorporates Delta, Gamma, Vega, and Theta to provide accurate profit/loss calculations for options positions, including time decay effects.
4. Three-Phase Trade Management - Implements systematic position management through Entry
Phase (initial risk), Profit Phase (approaching target), and Trailing Phase (EMA-based exit
management).
5. Multi-Level Alert System - Monitors price action, Greeks thresholds, time decay acceleration, and account risk levels to generate context-aware notifications.
How to use it?
Initial Setup:
1. Apply indicator to any optionable security
2. Toggle "In Position" ON when entering a trade
3. Set Direction (Call/Put) and Side (Long/Short)
4. Enter the underlying price at position entry
5. Specify number of contracts and risk percentage
Position Management:
Blue line shows entry price
Red line indicates stop loss level
Orange line displays risk/reward target
Purple EMA line activates after target hit
Monitor real-time P&L in trade panels
Alert Configuration:
Enable Advanced Alerts in settings
Set profit/loss notification thresholds
Configure Greek-based warnings
Activate time decay alerts for expiration
Risk Parameters:
Risk % determines stop distance from entry
Account Value sets position sizing limits
Contract Multiplier (standard = 100)
R:R Ratio defines profit targets
What makes it unique?
Options Risk Manager addresses the specific challenges of options trading that generic indicators miss. The script accounts for the inverse relationship in put options (profiting from price declines), incorporates Greeks for accurate P&L calculations, and provides options-specific limit orders for TradeStation integration.
The three-phase management system removes emotional decision-making by defining clear rules for position management. Phase transitions occur automatically based on price action, shifting from initial risk management to profit protection to trend-following modes.
Version 2.2.0's Priority 7 alert system provides intelligent notifications that include live metrics, risk warnings, and market context rather than simple price crosses.
Key Features Summary
Options-Specific Calculations - Proper handling of calls/puts with inverse relationships
Risk-Based Position Sizing - Consistent risk regardless of underlying price
Greeks Integration - Delta, Gamma, Vega, Theta for accurate tracking
Phase Management System - Systematic three-stage position handling
Advanced Alert System - Context-aware notifications with metrics
TradeStation Integration - Option limit orders for execution
Visual Risk Display - Clear chart overlays for all levels
Probability Calculator - Win/loss probability with expected value
Multi-Account Support - Scales from small to large accounts
Important Notes
This indicator requires manual input of option prices and Greeks (available from your broker's option chain). It functions as a risk management overlay and does not generate entry signals. The calculations assume standard options contracts of 100 shares.
Designed for TradeStation platform with full functionality. Basic features available on other platforms
without options data integration. Always verify calculations with your broker's risk system before placing
trades.
[Top] Simple Position + SL CalculatorThis indicator is a user-friendly tool designed to help traders easily calculate optimal position sizing, determine suitable stop-loss levels, and quantify maximum potential losses in dollar terms based on their personalized trading parameters.
Key Features:
Position Size Calculation: Automatically computes the number of shares to purchase based on the trader’s total account size and specified percentage of the account allocated per trade.
Stop-Loss Level: Suggests an appropriate stop-loss price point calculated based on the trader’s defined risk percentage per trade.
Max Loss Visualization: Clearly displays the maximum potential loss (in dollars) should the stop-loss be triggered.
Customizable Interface: Provides the flexibility to place the calculation table in different chart positions (Top Left, Top Right, Bottom Left, Bottom Right) according to user preference.
How to Use:
Enter your total Account Size.
Set the desired Position Size as a percentage of your account. (Typically, 1%–5% per trade is recommended for cash accounts.)
Define the Risk per Trade percentage (commonly between 0.05%–0.5%).
Choose your preferred Table Position to comfortably integrate with your trading chart.
Note:
If you identify a technical support level below the suggested stop-loss point, consider reducing your position size to manage the increased risk effectively.
Keep in mind that the calculations provided by this indicator are based solely on standard industry best practices and the specific inputs entered by you. They do not account for market volatility, news events, or any other factors outside the provided parameters. Always complement this indicator with sound technical and fundamental analysis.

Momentum Long + Short Strategy (BTC 3H)Momentum Long + Short Strategy (BTC 3H)
🔍 How It Works, Step by Step
Detect the Trend (📈/📉)
Calculate two moving averages (100-period and 500-period), either EMA or SMA.
For longs, we require MA100 > MA500 (uptrend).
For shorts, we block entries if MA100 exceeds MA500 by more than a set percentage (to avoid fading a powerful uptrend).
Apply Momentum Filters (⚡️)
RSI Filter: Measures recent strength—only allow longs when RSI crosses above its smoothed average, and shorts when RSI dips below the oversold threshold.
ADX Filter: Gauges trend strength—ensures we only enter when a meaningful trend exists (optional).
ATR Filter: Confirms volatility—avoids choppy, low-volatility conditions by requiring ATR to exceed its smoothed value (optional).
Confirm Entry Conditions (✅)
Long Entry:
Price is above both MAs
Trend alignment & optional filters pass ✅
Short Entry:
Price is below both MAs and below the lower Bollinger Band
RSI is sufficiently oversold
Trend-blocker & ATR filter pass ✅
Position Sizing & Risk (💰)
Each trade uses 100 % of account equity by default.
One pyramid addition allowed, so you can scale in if the move continues.
Commission and slippage assumptions built in for realistic backtests.
Stops & Exits (🛑)
Long Stop-Loss: e.g. 3 % below entry.
Long Auto-Exit: If price falls back under the 500-period MA.
Short Stop-Loss: e.g. 3 % above entry.
Short Take-Profit: e.g. 4 % below entry.
🎨 Why It’s Powerful & Customizable
Modular Filters: Turn on/off RSI, ADX, ATR filters to suit different market regimes.
Adjustable Thresholds: Fine-tune stop-loss %, take-profit %, RSI lengths, MA gaps and more.
Multi-Timeframe Potential: Although coded for 3 h BTC, you can adapt it to stocks, forex or other cryptos—just recalibrate!
Backtest Fine-Tuned: Default settings were optimized via backtesting on historical BTC data—but they’re not guarantees of future performance.
⚠️ Warning & Disclaimer
This strategy is for educational purposes only and designed for a toy fund. Crypto markets are highly volatile—you can lose 100 % of your capital. It is not a predictive “holy grail” but a rules-based framework using past data. The parameters have been fine-tuned on historical data and are not valid for future trades without fresh calibration. Always practice with paper-trading first, use proper risk management, and do your own research before risking real money. 🚨🔒
Good luck exploring and experimenting! 🚀📊

EMA Pullback Speed Strategy 📌 **Overview**
The **EMA Pullback Speed Strategy** is a trend-following approach that combines **price momentum** and **Exponential Moving Averages (EMA)**.
It aims to identify high-probability entry points during brief pullbacks within ongoing uptrends or downtrends.
The strategy evaluates **speed of price movement**, **relative position to dynamic EMA**, and **candlestick patterns** to determine ideal timing for entries.
One of the key concepts is checking whether the price has **“not pulled back too much”**, helping focus only on situations where the trend is likely to continue.
⚠️ This strategy is designed for educational and research purposes only. It does not guarantee future profits.
🧭 **Purpose**
This strategy addresses the common issue of **"jumping in too late during trends and taking unnecessary losses."**
By waiting for a healthy pullback and confirming signs of **trend resumption**, traders can enter with greater confidence and reduce false entries.
🎯 **Strategy Objectives**
* Enter in the direction of the prevailing trend to increase win rate
* Filter out false signals using pullback depth, speed, and candlestick confirmations
* Predefine Take-Profit (TP) and Stop-Loss (SL) levels for safer, rule-based trading
✨ **Key Features**
* **Dynamic EMA**: Reacts faster when price moves quickly, slower when market is calm – adapting to current momentum
* **Pullback Filter**: Avoids trades when price pulls back too far (e.g., more than 5%), indicating a trend may be weakening
* **Speed Check**: Measures how strongly the price returns to the trend using candlestick body speed (open-to-close range in ticks)
📊 **Trading Rules**
**■ Long Entry Conditions:**
* Current price is above the dynamic EMA (indicating uptrend)
* Price has pulled back toward the EMA (a "buy the dip" situation)
* Pullback depth is within the threshold (not excessive)
* Candlesticks show consecutive bullish closes and break the previous high
* Price speed is strong (positive movement with momentum)
**■ Short Entry Conditions:**
* Current price is below the dynamic EMA (indicating downtrend)
* Price has pulled back up toward the EMA (a "sell the rally" setup)
* Pullback is within range (not too deep)
* Candlesticks show consecutive bearish closes and break the previous low
* Price speed is negative (downward momentum confirmed)
**■ Exit Conditions (TP/SL):**
* **Take-Profit (TP):** Fixed 1.5% target above/below entry price
* **Stop-Loss (SL):** Based on recent price volatility, calculated using ATR × 4
💰 **Risk Management Parameters**
* Symbol & Timeframe: BTCUSD on 1-hour chart (H1)
* Test Capital: \$3000 (simulated account)
* Commission: 0.02%
* Slippage: 2 ticks (minimal execution lag)
* Max risk per trade: 5% of account balance
* Backtest Period: Aug 30, 2023 – May 9, 2025
* Profit Factor (PF): 1.965 (Net profit ÷ Net loss, including spreads & fees)
⚙️ **Trading Parameters & Indicator Settings**
* Maximum EMA Length: 50
* Accelerator Multiplier: 3.0
* Pullback Threshold: 5.0%
* ATR Period: 14
* ATR Multiplier (SL distance): 4.0
* Fixed TP: 1.5%
* Short-term EMA: 21
* Long-term EMA: 50
* Long Speed Threshold: ≥ 1000.0 (ticks)
* Short Speed Threshold: ≤ -1000.0 (ticks)
⚠️Adjustments are based on BTCUSD.
⚠️Forex and other currency pairs require separate adjustments.
🔧 **Strategy Improvements & Uniqueness**
Unlike basic moving average crossovers or RSI triggers, this strategy emphasizes **"momentum-supported pullbacks"**.
By combining dynamic EMA, speed checks, and candlestick signals, it captures trades **as if surfing the wave of a trend.**
Its built-in filters help **avoid overextended pullbacks**, which often signal the trend is ending – making it more robust than traditional trend-following systems.
✅ **Summary**
The **EMA Pullback Speed Strategy** is easy to understand, rule-based, and highly reproducible – ideal for both beginners and intermediate traders.
Because it shows **clear visual entry/exit points** on the chart, it’s also a great tool for practicing discretionary trading decisions.
⚠️ Past performance is not a guarantee of future results.
Always respect your Stop-Loss levels and manage your position size according to your risk tolerance.

TCP | Money Management indicator | Crypto Version📌 TCP | Money Management Indicator | Crypto Version
A robust, multi-target risk and capital management indicator tailored for crypto traders. Whether you're trading spot, perpetual futures, or leverage tokens, this tool empowers you with precise control over risk, reward, and position sizing—directly on your chart. Eliminate guesswork and trade with confidence.
🔰 Introduction: Master Your Capital, Master Your Trades
Poor money management is the number one reason traders lose their accounts, even with solid strategies. The TCP Money Management Indicator, built by Trade City Pro (TCP), solves this problem by providing a structured, rule-based approach to capital allocation.
Want to dive deeper into the concept of money management? Check out our comprehensive tutorial on TradingView, " TradeCityPro Academy: Money Management ", to understand the principles that power this indicator and transform your trading mindset.
This indicator equips you to:
• Calculate optimal position sizes based on your capital, risk percentage, and leverage
• Set up to 5 customizable take-profit targets with partial close percentages
• Access real-time metrics like Risk-to-Reward (R/R), USD profit, and margin usage
• Trade with discipline, avoiding emotional or inconsistent decisions
💸 Money Management Formula
The indicator uses a professional capital allocation model:
Position Size = (Capital × Risk %) ÷ (Stop Loss % × Leverage)
From this, it calculates:
• Total risk amount in USD
• Optimal position size for your trade
• Margin required for each take-profit target
• Adjusted R/R for each target, accounting for partial position closures
🛠 How to Use
Enter Trade Parameters: Input your capital, risk %, leverage, entry price, and stop-loss price.
Set Take-Profit Targets: Enable 1 to 5 take-profit levels and specify the percentage of the position to close at each.
Real-Time Calculations: The indicator automatically computes:
• R/R ratio for each target
• Profit in USD for each partial close
• Margin used per target (in % and USD)
Visualize Your Trade:
• Price levels for entry, stop-loss, and take-profits are plotted on the chart.
• A dynamic info panel on the left side displays all key metrics.
🔄 Dynamic Adjustments: As each take-profit target is hit and a portion of the position is closed, the indicator recalculates the remaining position size, expected profit, R/R, and margin for subsequent targets. This ensures accuracy and reflects real-world trade behavior.
📊 Table Overview
The left-side panel provides a clear snapshot:
• Trade Setup: Capital, entry price, stop-loss, risk amount, and position size
• Per Target: Percentage closed, R/R, profit in USD, and margin used
• Summary: Total expected profit across all targets
⚙️ Settings Panel
• Total Capital ($): Your account size for the trade
• Risk per Trade (%): The percentage of capital you’re willing to risk
• Leverage: The leverage applied to the trade
• Entry/Stop-Loss Prices: Define your trade’s risk zone
• Take-Profit Targets (1–5): Set price levels and percentage to close at each
🔍 Use Case Example
Imagine you have $1,000 capital, risking 1%, using 10x leverage:
• Entry: $100 | Stop-Loss: $95
• TP1: $110 (close 50%) | TP2: $115 (close 50%)
The indicator calculates the exact position size, profit at each target, and margin allocation in real time, with all metrics displayed on the chart.
✅ Why Traders Love It
• Precision: No more manual calculations or guesswork
• Versatility: Works on all crypto pairs (BTC, ETH, altcoins, etc.)
• Flexibility: Perfect for scalping, swing trading, or futures strategies
• Universal: Compatible with all timeframes
• Transparency: Fully manual, with clear and reliable outputs
🧩 Built by Trade City Pro (TCP)
Developed by TCP, a trusted name in trading tools, used by over 150,000 traders worldwide. This indicator is coded in Pine Script v5, ensuring compatibility with TradingView’s platform.
🧾 Final Notes
• No Auto-Trading: This is a manual tool for disciplined traders
• No Repainting: All calculations are accurate and non-repainting
• Tested: Rigorously validated across major crypto pairs
• Publish-Ready: Built for seamless use on TradingView
🔗 Resources
• Money Management Tutorial: Learn the fundamentals of capital management with our detailed guide: TradeCityPro Academy: Money Management
• TradingView Profile: Explore more tools by TCP on TradingView

Dskyz (DAFE) Adaptive Regime - Quant Machine ProDskyz (DAFE) Adaptive Regime - Quant Machine Pro:
Buckle up for the Dskyz (DAFE) Adaptive Regime - Quant Machine Pro, is a strategy that’s your ultimate edge for conquering futures markets like ES, MES, NQ, and MNQ. This isn’t just another script—it’s a quant-grade powerhouse, crafted with precision to adapt to market regimes, deliver multi-factor signals, and protect your capital with futures-tuned risk management. With its shimmering DAFE visuals, dual dashboards, and glowing watermark, it turns your charts into a cyberpunk command center, making trading as thrilling as it is profitable.
Unlike generic scripts clogging up the space, the Adaptive Regime is a DAFE original, built from the ground up to tackle the chaos of futures trading. It identifies market regimes (Trending, Range, Volatile, Quiet) using ADX, Bollinger Bands, and HTF indicators, then fires trades based on a weighted scoring system that blends candlestick patterns, RSI, MACD, and more. Add in dynamic stops, trailing exits, and a 5% drawdown circuit breaker, and you’ve got a system that’s as safe as it is aggressive. Whether you’re a newbie or a prop desk pro, this strat’s your ticket to outsmarting the markets. Let’s break down every detail and see why it’s a must-have.
Why Traders Need This Strategy
Futures markets are a gauntlet—fast moves, volatility spikes (like the April 28, 2025 NQ 1k-point drop), and institutional traps that punish the unprepared. Meanwhile, platforms are flooded with low-effort scripts that recycle old ideas with zero innovation. The Adaptive Regime stands tall, offering:
Adaptive Intelligence: Detects market regimes (Trending, Range, Volatile, Quiet) to optimize signals, unlike one-size-fits-all scripts.
Multi-Factor Precision: Combines candlestick patterns, MA trends, RSI, MACD, volume, and HTF confirmation for high-probability trades.
Futures-Optimized Risk: Calculates position sizes based on $ risk (default: $300), with ATR or fixed stops/TPs tailored for ES/MES.
Bulletproof Safety: 5% daily drawdown circuit breaker and trailing stops keep your account intact, even in chaos.
DAFE Visual Mastery: Pulsing Bollinger Band fills, dynamic SL/TP lines, and dual dashboards (metrics + position) make signals crystal-clear and charts a work of art.
Original Craftsmanship: A DAFE creation, built with community passion, not a rehashed clone of generic code.
Traders need this because it’s a complete, adaptive system that blends quant smarts, user-friendly design, and DAFE flair. It’s your edge to trade with confidence, cut through market noise, and leave the copycats in the dust.
Strategy Components
1. Market Regime Detection
The strategy’s brain is its ability to classify market conditions into five regimes, ensuring signals match the environment.
How It Works:
Trending (Regime 1): ADX > 20, fast/slow EMA spread > 0.3x ATR, HTF RSI > 50 or MACD bullish (htf_trend_bull/bear).
Range (Regime 2): ADX < 25, price range < 3% of close, no HTF trend.
Volatile (Regime 3): BB width > 1.5x avg, ATR > 1.2x avg, HTF RSI overbought/oversold.
Quiet (Regime 4): BB width < 0.8x avg, ATR < 0.9x avg.
Other (Regime 5): Default for unclear conditions.
Indicators: ADX (14), BB width (20), ATR (14, 50-bar SMA), HTF RSI (14, daily default), HTF MACD (12,26,9).
Why It’s Brilliant:
Regime detection adapts signals to market context, boosting win rates in trending or volatile conditions.
HTF RSI/MACD add a big-picture filter, rare in basic scripts.
Visualized via gradient background (green for Trending, orange for Range, red for Volatile, gray for Quiet, navy for Other).
2. Multi-Factor Signal Scoring
Entries are driven by a weighted scoring system that combines candlestick patterns, trend, momentum, and volume for robust signals.
Candlestick Patterns:
Bullish: Engulfing (0.5), hammer (0.4 in Range, 0.2 else), morning star (0.2), piercing (0.2), double bottom (0.3 in Volatile, 0.15 else). Must be near support (low ≤ 1.01x 20-bar low) with volume spike (>1.5x 20-bar avg).
Bearish: Engulfing (0.5), shooting star (0.4 in Range, 0.2 else), evening star (0.2), dark cloud (0.2), double top (0.3 in Volatile, 0.15 else). Must be near resistance (high ≥ 0.99x 20-bar high) with volume spike.
Logic: Patterns are weighted higher in specific regimes (e.g., hammer in Range, double bottom in Volatile).
Additional Factors:
Trend: Fast EMA (20) > slow EMA (50) + 0.5x ATR (trend_bull, +0.2); opposite for trend_bear.
RSI: RSI (14) < 30 (rsi_bull, +0.15); > 70 (rsi_bear, +0.15).
MACD: MACD line > signal (12,26,9, macd_bull, +0.15); opposite for macd_bear.
Volume: ATR > 1.2x 50-bar avg (vol_expansion, +0.1).
HTF Confirmation: HTF RSI < 70 and MACD bullish (htf_bull_confirm, +0.2); RSI > 30 and MACD bearish (htf_bear_confirm, +0.2).
Scoring:
bull_score = sum of bullish factors; bear_score = sum of bearish. Entry requires score ≥ 1.0.
Example: Bullish engulfing (0.5) + trend_bull (0.2) + rsi_bull (0.15) + htf_bull_confirm (0.2) = 1.05, triggers long.
Why It’s Brilliant:
Multi-factor scoring ensures signals are confirmed by multiple market dynamics, reducing false positives.
Regime-specific weights make patterns more relevant (e.g., hammers shine in Range markets).
HTF confirmation aligns with the big picture, a quant edge over simplistic scripts.
3. Futures-Tuned Risk Management
The risk system is built for futures, calculating position sizes based on $ risk and offering flexible stops/TPs.
Position Sizing:
Logic: Risk per trade (default: $300) ÷ (stop distance in points * point value) = contracts, capped at max_contracts (default: 5). Point value = tick value (e.g., $12.5 for ES) * ticks per point (4) * contract multiplier (1 for ES, 0.1 for MES).
Example: $300 risk, 8-point stop, ES ($50/point) → 0.75 contracts, rounded to 1.
Impact: Precise sizing prevents over-leverage, critical for micro contracts like MES.
Stops and Take-Profits:
Fixed: Default stop = 8 points, TP = 16 points (2:1 reward/risk).
ATR-Based: Stop = 1.5x ATR (default), TP = 3x ATR, enabled via use_atr_for_stops.
Logic: Stops set at swing low/high ± stop distance; TPs at 2x stop distance from entry.
Impact: ATR stops adapt to volatility, while fixed stops suit stable markets.
Trailing Stops:
Logic: Activates at 50% of TP distance. Trails at close ± 1.5x ATR (atr_multiplier). Longs: max(trail_stop_long, close - ATR * 1.5); shorts: min(trail_stop_short, close + ATR * 1.5).
Impact: Locks in profits during trends, a game-changer in volatile sessions.
Circuit Breaker:
Logic: Pauses trading if daily drawdown > 5% (daily_drawdown = (max_equity - equity) / max_equity).
Impact: Protects capital during black swan events (e.g., April 27, 2025 ES slippage).
Why It’s Brilliant:
Futures-specific inputs (tick value, multiplier) make it plug-and-play for ES/MES.
Trailing stops and circuit breaker add pro-level safety, rare in off-the-shelf scripts.
Flexible stops (ATR or fixed) suit different trading styles.
4. Trade Entry and Exit Logic
Entries and exits are precise, driven by bull_score/bear_score and protected by drawdown checks.
Entry Conditions:
Long: bull_score ≥ 1.0, no position (position_size <= 0), drawdown < 5% (not pause_trading). Calculates contracts, sets stop at swing low - stop points, TP at 2x stop distance.
Short: bear_score ≥ 1.0, position_size >= 0, drawdown < 5%. Stop at swing high + stop points, TP at 2x stop distance.
Logic: Tracks entry_regime for PNL arrays. Closes opposite positions before entering.
Exit Conditions:
Stop-Loss/Take-Profit: Hits stop or TP (strategy.exit).
Trailing Stop: Activates at 50% TP, trails by ATR * 1.5.
Emergency Exit: Closes if price breaches stop (close < long_stop_price or close > short_stop_price).
Reset: Clears stop/TP prices when flat (position_size = 0).
Why It’s Brilliant:
Score-based entries ensure multi-factor confirmation, filtering out weak signals.
Trailing stops maximize profits in trends, unlike static exits in basic scripts.
Emergency exits add an extra safety layer, critical for futures volatility.
5. DAFE Visuals
The visuals are pure DAFE magic, blending function with cyberpunk flair to make signals intuitive and charts stunning.
Shimmering Bollinger Band Fill:
Display: BB basis (20, white), upper/lower (green/red, 45% transparent). Fill pulses (30–50 alpha) by regime, with glow (60–95 alpha) near bands (close ≥ 0.995x upper or ≤ 1.005x lower).
Purpose: Highlights volatility and key levels with a futuristic glow.
Visuals make complex regimes and signals instantly clear, even for newbies.
Pulsing effects and regime-specific colors add a DAFE signature, setting it apart from generic scripts.
BB glow emphasizes tradeable levels, enhancing decision-making.
Chart Background (Regime Heatmap):
Green — Trending Market: Strong, sustained price movement in one direction. The market is in a trend phase—momentum follows through.
Orange — Range-Bound: Market is consolidating or moving sideways, with no clear up/down trend. Great for mean reversion setups.
Red — Volatile Regime: High volatility, heightened risk, and larger/faster price swings—trade with caution.
Gray — Quiet/Low Volatility: Market is calm and inactive, with small moves—often poor conditions for most strategies.
Navy — Other/Neutral: Regime is uncertain or mixed; signals may be less reliable.
Bollinger Bands Glow (Dynamic Fill):
Neon Red Glow — Warning!: Price is near or breaking above the upper band; momentum is overstretched, watch for overbought conditions or reversals.
Bright Green Glow — Opportunity!: Price is near or breaking below the lower band; market could be oversold, prime for bounce or reversal.
Trend Green Fill — Trending Regime: Fills between bands with green when the market is trending, showing clear momentum.
Gold/Yellow Fill — Range Regime: Fills with gold/aqua in range conditions, showing the market is sideways/oscillating.
Magenta/Red Fill — Volatility Spike: Fills with vivid magenta/red during highly volatile regimes.
Blue Fill — Neutral/Quiet: A soft blue glow for other or uncertain market states.
Moving Averages:
Display: Blue fast EMA (20), red slow EMA (50), 2px.
Purpose: Shows trend direction, with trend_dir requiring ATR-scaled spread.
Dynamic SL/TP Lines:
Display: Pulsing colors (red SL, green TP for Trending; yellow/orange for Range, etc.), 3px, with pulse_alpha for shimmer.
Purpose: Tracks stops/TPs in real-time, color-coded by regime.
6. Dual Dashboards
Two dashboards deliver real-time insights, making the strat a quant command center.
Bottom-Left Metrics Dashboard (2x13):
Metrics: Mode (Active/Paused), trend (Bullish/Bearish/Neutral), ATR, ATR avg, volume spike (YES/NO), RSI (value + Oversold/Overbought/Neutral), HTF RSI, HTF trend, last signal (Buy/Sell/None), regime, bull score.
Display: Black (29% transparent), purple title, color-coded (green for bullish, red for bearish).
Purpose: Consolidates market context and signal strength.
Top-Right Position Dashboard (2x7):
Metrics: Regime, position side (Long/Short/None), position PNL ($), SL, TP, daily PNL ($).
Display: Black (29% transparent), purple title, color-coded (lime for Long, red for Short).
Purpose: Tracks live trades and profitability.
Why It’s Brilliant:
Dual dashboards cover market context and trade status, a rare feature.
Color-coding and concise metrics guide beginners (e.g., green “Buy” = go).
Real-time PNL and SL/TP visibility empower disciplined trading.
7. Performance Tracking
Logic: Arrays (regime_pnl_long/short, regime_win/loss_long/short) track PNL and win/loss by regime (1–5). Updated on trade close (barstate.isconfirmed).
Purpose: Prepares for future adaptive thresholds (e.g., adjust bull_score min based on regime performance).
Why It’s Brilliant: Lays the groundwork for self-optimizing logic, a quant edge over static scripts.
Key Features
Regime-Adaptive: Optimizes signals for Trending, Range, Volatile, Quiet markets.
Futures-Optimized: Precise sizing for ES/MES with tick-based risk inputs.
Multi-Factor Signals: Candlestick patterns, RSI, MACD, and HTF confirmation for robust entries.
Dynamic Exits: ATR/fixed stops, 2:1 TPs, and trailing stops maximize profits.
Safe and Smart: 5% drawdown breaker and emergency exits protect capital.
DAFE Visuals: Shimmering BB fill, pulsing SL/TP, and dual dashboards.
Backtest-Ready: Fixed qty and tick calc for accurate historical testing.
How to Use
Add to Chart: Load on a 5min ES/MES chart in TradingView.
Configure Inputs: Set instrument (ES/MES), tick value ($12.5/$1.25), multiplier (1/0.1), risk ($300 default). Enable ATR stops for volatility.
Monitor Dashboards: Bottom-left for regime/signals, top-right for position/PNL.
Backtest: Run in strategy tester to compare regimes.
Live Trade: Connect to Tradovate or similar. Watch for slippage (e.g., April 27, 2025 ES issues).
Replay Test: Try April 28, 2025 NQ drop to see regime shifts and stops.
Disclaimer
Trading futures involves significant risk of loss and is not suitable for all investors. Past performance does not guarantee future results. Backtest results may differ from live trading due to slippage, fees, or market conditions. Use this strategy at your own risk, and consult a financial advisor before trading. Dskyz (DAFE) Trading Systems is not responsible for any losses incurred.
Backtesting:
Frame: 2023-09-20 - 2025-04-29
Slippage: 3
Fee Typical Range (per side, per contract)
CME Exchange $1.14 – $1.20
Clearing $0.10 – $0.30
NFA Regulatory $0.02
Firm/Broker Commis. $0.25 – $0.80 (retail prop)
TOTAL $1.60 – $2.30 per side
Round Turn: (enter+exit) = $3.20 – $4.60 per contract
Final Notes
The Dskyz (DAFE) Adaptive Regime - Quant Machine Pro is more than a strategy—it’s a revolution. Crafted with DAFE’s signature precision, it rises above generic scripts with adaptive regimes, quant-grade signals, and visuals that make trading a thrill. Whether you’re scalping MES or swinging ES, this system empowers you to navigate markets with confidence and style. Join the DAFE crew, light up your charts, and let’s dominate the futures game!
(This publishing will most likely be taken down do to some miscellaneous rule about properly displaying charting symbols, or whatever. Once I've identified what part of the publishing they want to pick on, I'll adjust and repost.)
Use it with discipline. Use it with clarity. Trade smarter.
**I will continue to release incredible strategies and indicators until I turn this into a brand or until someone offers me a contract.
Created by Dskyz, powered by DAFE Trading Systems. Trade smart, trade bold.

[blackcat] L3 Hull SeekerOVERVIEW
The L3 Hull Seeker is a comprehensive trading indicator that combines Hull Moving Average (HMA) analysis with robust position management and risk control features. This script is designed to help traders identify potential entry and exit points while maintaining strict risk management protocols.
KEY FEATURES
• Hull MA Analysis:
Advanced Hull Moving Average calculations
Separate Hull MA lines for Close and Open prices
Visual color coding for trend direction
Customizable length parameter for flexibility
• Position Tracking:
Real-time monitoring of long and short positions
Maximum position limit control
Clear position status indicators on chart
• Risk Management System:
User-defined Take Profit percentage
User-defined Stop Loss percentage
Optional activation of TP/SL features
Dynamic label markers for important levels
• Alert System:
Buy/Sell entry alerts
Take Profit/Stop Loss exit alerts
Position status changes
HOW TO USE
Setup Initial Parameters:
Hull MA Length: Adjust based on your trading timeframe
Take Profit Percentage: Set according to your risk tolerance
Stop Loss Percentage: Define your maximum acceptable loss
Enable/Disable Features:
Toggle Take Profit/Stop Loss options as needed
Adjust alert conditions for your trading style
Monitor Trading Signals:
Watch for crossover/crossunder signals
Track position status through labels
Monitor entry and exit alerts
Manage Risk:
Use TP/SL features to control position size
Monitor pyramiding limits
Review position status regularly
TRADE MANAGEMENT
• Entry Conditions:
Long Entry: HullMA_close crosses above HullMA_open
Short Entry: HullMA_close crosses below HullMA_open
• Exit Conditions:
Take Profit: Price reaches defined percentage above/below entry
Stop Loss: Price reaches defined percentage below/above entry
• Position Control:
Limited to one position at a time
Automatic position tracking
Clear visual indication of current trades
TECHNICAL DETAILS
• Hull MA Calculation:
Uses WMA (Weighted Moving Average) for precise calculations
Optimized for trend-following strategies
Smoothed Hull MA lines for better readability
• Label System:
Clear buy/sell markers
Take Profit and Stop Loss indicators
Real-time position status updates
• Alert Configuration:
Customizable alert messages
Multiple alert conditions
Option to enable/disable specific alerts
LIMITATIONS
⚠️ Important Considerations:
Results may vary across different market conditions
Historical performance does not guarantee future results
Always backtest strategy before live trading
Consider complementing with additional analysis tools
BEST PRACTICES
• Recommended Timeframes:
Daily charts for long-term strategies
4-hour charts for swing trading
1-hour charts for short-term trading
• Risk Management Tips:
Start with small position sizes
Always use TP/SL in live trading
Monitor market volatility before entering trades
TROUBLESHOOTING
• Common Issues:
Ensure proper chart resolution
Verify alert conditions are enabled
Check for conflicting indicators
• Performance Optimization:
Use appropriate timeframe for your strategy
Adjust indicator parameters based on market conditions
Monitor for potential overfitting

Enhanced Execution ToolA comprehensive position sizing calculator for disciplined risk management
Description :
This tool provides traders with precise position sizing calculations based on their account parameters and market conditions. The indicator calculates optimal position sizes for different entry scenarios while maintaining strict risk control.
Key Features:
Multiple entry options (High, Close, Manual)
Flexible stop loss configuration (LoD or Previous Day Low)
Account-based risk management (1% risk by default)
ATR-based distance metrics for volatility assessment
Clear visual table displaying all critical trade parameters
How to Use:
Configure your account size and risk percentage
Select your preferred entry methods (High/Close/Manual)
Choose stop loss reference (Low of Day or Previous Day Low)
View calculated position sizes and risk parameters
For manual entries, input your desired entry and stop prices
Input Parameters:
Account Configuration: Set your capital and risk tolerance
Entry Options: Choose which entry methods to display
Stop Loss: Select stop loss reference level
Technical Settings: Adjust ATR length and distance limits
Display Options: Customize table appearance
Output Includes:
Risk amount in dollars
Risk as percentage of entry price
Entry to stop loss as percentage of ATR
Stop loss price
Entry price
Position size as % of account
Share quantity
Ideal For:
Traders who want to maintain consistent risk management
Those who need quick position sizing calculations
Investors who trade with multiple entry strategies
Note: Always verify calculations before executing trades. This tool is designed to assist with trade planning, not as trade advice.

Dskyz (DAFE) MAtrix with ATR-Powered Precision Dskyz (DAFE) MAtrix with ATR-Powered Precision
This cutting‐edge futures trading strategy built to thrive in rapidly changing market conditions. Developed for high-frequency futures trading on instruments such as the CME Mini MNQ, this strategy leverages a matrix of sophisticated moving averages combined with ATR-based filters to pinpoint high-probability entries and exits. Its unique combination of adaptable technical indicators and multi-timeframe trend filtering sets it apart from standard strategies, providing enhanced precision and dynamic responsiveness.
imgur.com
Core Functional Components
1. Advanced Moving Averages
A distinguishing feature of the DAFE strategy is its robust, multi-choice moving averages (MAs). Clients can choose from a wide array of MAs—each with specific strengths—in order to fine-tune their trading signals. The code includes user-defined functions for the following MAs:
imgur.com
Hull Moving Average (HMA):
The hma(src, len) function calculates the HMA by using weighted moving averages (WMAs) to reduce lag considerably while smoothing price data. This function computes an intermediate WMA of half the specified length, then a full-length WMA, and finally applies a further WMA over the square root of the length. This design allows for rapid adaptation to price changes without the typical delays of traditional moving averages.
Triple Exponential Moving Average (TEMA):
Implemented via tema(src, len), TEMA uses three consecutive exponential moving averages (EMAs) to effectively cancel out lag and capture price momentum. The final formula—3 * (ema1 - ema2) + ema3—produces a highly responsive indicator that filters out short-term noise.
Double Exponential Moving Average (DEMA):
Through the dema(src, len) function, DEMA calculates an EMA and then a second EMA on top of it. Its simplified formula of 2 * ema1 - ema2 provides a smoother curve than a single EMA while maintaining enhanced responsiveness.
Volume Weighted Moving Average (VWMA):
With vwma(src, len), this MA accounts for trading volume by weighting the price, thereby offering a more contextual picture of market activity. This is crucial when volume spikes indicate significant moves.
Zero Lag EMA (ZLEMA):
The zlema(src, len) function applies a correction to reduce the inherent lag found in EMAs. By subtracting a calculated lag (based on half the moving average window), ZLEMA is exceptionally attuned to recent price movements.
Arnaud Legoux Moving Average (ALMA):
The alma(src, len, offset, sigma) function introduces ALMA—a type of moving average designed to be less affected by outliers. With parameters for offset and sigma, it allows customization of the degree to which the MA reacts to market noise.
Kaufman Adaptive Moving Average (KAMA):
The custom kama(src, len) function is noteworthy for its adaptive nature. It computes an efficiency ratio by comparing price change against volatility, then dynamically adjusts its smoothing constant. This results in an MA that quickly responds during trending periods while remaining smoothed during consolidation.
Each of these functions—integrated into the strategy—is selectable by the trader (via the fastMAType and slowMAType inputs). This flexibility permits the tailored application of the MA most suited to current market dynamics and individual risk management preferences.
2. ATR-Based Filters and Risk Controls
ATR Calculation and Volatility Filter:
The strategy computes the Average True Range (ATR) over a user-defined period (atrPeriod). ATR is then used to derive both:
Volatility Assessment: Expressed as a ratio of ATR to closing price, ensuring that trades are taken only when volatility remains within a safe, predefined threshold (volatilityThreshold).
ATR-Based Entry Filters: Implemented as atrFilterLong and atrFilterShort, these conditions ensure that for long entries the price is sufficiently above the slow MA and vice versa for shorts. This acts as an additional confirmation filter.
Dynamic Exit Management:
The exit logic employs a dual approach:
Fixed Stop and Profit Target: Stops and targets are set at multiples of ATR (fixedStopMultiplier and profitTargetATRMult), helping manage risk in volatile markets.
Trailing Stop Adjustments: A trailing stop is calculated using the ATR multiplied by a user-defined offset (trailOffset), which captures additional profits as the trade moves favorably while protecting against reversals.
3. Multi-Timeframe Trend Filtering
The strategy enhances its signal reliability by leveraging a secondary, higher timeframe analysis:
15-Minute Trend Analysis:
By retrieving 15-minute moving averages (fastMA15m and slowMA15m) via request.security, the strategy determines the broader market trend. This secondary filter (enabled or disabled through useTrendFilter) ensures that entries are aligned with the prevailing market direction, thereby reducing the incidence of false signals.
4. Signal and Execution Logic
Combined MA Alignment:
The entry conditions are based primarily on the alignment of the fast and slow MAs. A long condition is triggered when the current price is above both MAs and the fast MA is above the slow MA—complemented by the ATR filter and volume conditions. The reverse applies for a short condition.
Volume and Time Window Validation:
Trades are permitted only if the current volume exceeds a minimum (minVolume) and the current hour falls within the predefined trading window (tradingStartHour to tradingEndHour). An additional volume spike check (comparing current volume to a moving average of past volumes) further filters for optimal market conditions.
Comprehensive Order Execution:
The strategy utilizes flexible order execution functions that allow pyramiding (up to 10 positions), ensuring that it can scale into positions as favorable conditions persist. The use of both market entries and automated exits (with profit targets, stop-losses, and trailing stops) ensures that risk is managed at every step.
5. Integrated Dashboard and Metrics
For transparency and real-time analysis, the strategy includes:
On-Chart Visualizations:
Both fast and slow MAs are plotted on the chart, making it easy to see the market’s technical foundation.
Dynamic Metrics Dashboard:
A built-in table displays crucial performance statistics—including current profit/loss, equity, ATR (both raw and as a percentage), and the percentage gap between the moving averages. These metrics offer immediate insight into the health and performance of the strategy.
Input Parameters: Detailed Breakdown
Every input is meticulously designed to offer granular control:
Fast & Slow Lengths:
Determine the window size for the fast and slow moving averages. Smaller values yield more sensitivity, while larger values provide a smoother, delayed response.
Fast/Slow MA Types:
Choose the type of moving average for fast and slow signals. The versatility—from basic SMA and EMA to more complex ones like HMA, TEMA, ZLEMA, ALMA, and KAMA—allows customization to fit different market scenarios.
ATR Parameters:
atrPeriod and atrMultiplier shape the volatility assessment, directly affecting entry filters and risk management through stop-loss and profit target levels.
Trend and Volume Filters:
Inputs such as useTrendFilter, minVolume, and the volume spike condition help confirm that a trade occurs in active, trending markets rather than during periods of low liquidity or market noise.
Trading Hours:
Restricting trade execution to specific hours (tradingStartHour and tradingEndHour) helps avoid illiquid or choppy markets outside of prime trading sessions.
Exit Strategies:
Parameters like trailOffset, profitTargetATRMult, and fixedStopMultiplier provide multiple layers of risk management and profit protection by tailoring how exits are generated relative to current market conditions.
Pyramiding and Fixed Trade Quantity:
The strategy supports multiple entries within a trend (up to 10 positions) and sets a predefined trade quantity (fixedQuantity) to maintain consistent exposure and risk per trade.
Dashboard Controls:
The resetDashboard input allows for on-the-fly resetting of performance metrics, keeping the strategy’s performance dashboard accurate and up-to-date.
Why This Strategy is Truly Exceptional
Multi-Faceted Adaptability:
The ability to switch seamlessly between various moving average types—each suited to particular market conditions—enables the strategy to adapt dynamically. This is a testament to the high level of coding sophistication and market insight infused within the system.
Robust Risk Management:
The integration of ATR-based stops, profit targets, and trailing stops ensures that every trade is executed with well-defined risk parameters. The system is designed to mitigate unexpected market swings while optimizing profit capture.
Comprehensive Market Filtering:
By combining moving average crossovers with volume analysis, volatility thresholds, and multi-timeframe trend filters, the strategy only enters trades under the most favorable conditions. This multi-layered filtering reduces noise and enhances signal quality.
-Final Thoughts-
The Dskyz Adaptive Futures Elite (DAFE) MAtrix with ATR-Powered Precision strategy is not just another trading algorithm—it is a multi-dimensional, fully customizable system built on advanced technical principles and sophisticated risk management techniques. Every function and input parameter has been carefully engineered to provide traders with a system that is both powerful and transparent.
For clients seeking a state-of-the-art trading solution that adapts dynamically to market conditions while maintaining strict discipline in risk management, this strategy truly stands in a class of its own.
****Please show support if you enjoyed this strategy. I'll have more coming out in the near future!!
-Dskyz
Caution
DAFE is experimental, not a profit guarantee. Futures trading risks significant losses due to leverage. Backtest, simulate, and monitor actively before live use. All trading decisions are your responsibility.

BB Breakout + Momentum Squeeze [Strategy]This Strategy is Based on 3 free indicators
- Bollinger Bands Breakout Oscillator: Link
- TTM Squeeze Pro: Link
- Rolling ATR Bands: Link
Bollinger Bands Breakout Oscillator - This tool shows how strong a market trend is by measuring how often prices move outside their normal Bollinger bands range. It helps you see whether prices are strongly moving in one direction or just moving sideways. By looking at how much and how frequently prices push beyond their typical boundaries, you can identify which direction the market is heading over your selected time period.
TM Squeeze Pro - This is a custom version of the TTM Squeeze indicator.
It's designed to help traders spot consolidation phases in the market (when price is coiling or "squeezing") and to catch breakouts early when volatility returns. The logic is based on the relationship between Bollinger Bands and Keltner Channels, combined with a momentum oscillator to show direction and strength.
Rolling ATR Bands - This indicator combines volatility bands (ATR) with momentum and trend signals to show where the market might be breaking out, retesting, or trending. It's highly visual and helpful for traders looking to time entries/exits during trending or volatile moves.
Logic Of the Strategy:
We are going to use the Bollinger Bands Breakout to determine the direction of the market. Than check the Volatility of the price by looking at the TTM Squeeze indicator. And use the ATR Bands to determine dynamic Stop Losses and based on the calculate the Take Profit targets and quantity for each position dynamically.
For the Long Setup:
1. We need to see the that Bull Power (Green line of the Bollinger Bands Breakout Oscilator) is crossing the level of 50.
2. Check the presence of volatility (Green dot based on the TTM Squeeze indicator)
For the Short Setup:
1. We need to see the that Bear Power (Red line of the Bollinger Bands Breakout Oscilator) is crossing the level of 50.
2. Check the presence of volatility (Green dot based on the TTM Squeeze indicator)
Stop Loss is determined by the Lower ATR Band (for the Long entry) and Upper ATR Band (For the Short entry)
Take Profit is 1:1.5 risk reward ration, which means if the Stop loss is 1% the TP target will be 1.5%
Move stop Loss to Breakeven: If the price will go in the direction of the trade for at least half of the Risk Reward target then the stop will automatically be adjusted to the entry price. For Example: the Stop Loss is 1%, the price has move at least 0.5% in the direction of your trade and that will move the Stop Loss level to the Entry point.
You can Adjust the parameters for each indicator used in that script and also adjust the Risk and Money management block to see how the PnL will change.

Falcon SignalsThis script is a TradingView Pine Script for a trading strategy called "Falcon Signals." It combines multiple technical indicators and strategies to generate buy and sell signals. Here’s a breakdown of what the script does:
1. Supertrend Indicator:
The script calculates the Supertrend indicator using the Average True Range (ATR) and a specified multiplier (factor). The Supertrend is used to define the trend direction, with a green line for an uptrend and a red line for a downtrend.
2. EMA (Exponential Moving Average):
Two EMAs are used: a fast EMA (9-period) and a slow EMA (21-period). The script checks for crossovers of the fast EMA above or below the slow EMA as a basis for buying and selling signals.
3. RSI (Relative Strength Index):
The RSI (14-period) is used to measure the momentum of the price. A buy signal is generated when the RSI is less than 70, while a sell signal is generated when it’s greater than 30.
4. Take Profit (TP) and Stop Loss (SL):
The script allows users to set custom percentages for take profit and stop loss. The take profit is set at a certain percentage above the entry price for buy signals, and the stop loss is set at a percentage below the entry price, and vice versa for sell signals.
5. Trailing Stop:
A trailing stop can be enabled, which dynamically adjusts the stop loss level as the price moves in the favorable direction. If the price moves against the position by a certain trailing percentage, the position will be closed.
6. Engulfing Patterns:
The script checks for bullish and bearish engulfing candlestick patterns, indicating potential reversals. A bullish engulfing pattern is marked with a teal label ("🔄 Reversal Up"), and a bearish engulfing pattern is marked with a fuchsia label ("🔄 Reversal Down").
7. Plotting:
The script plots various indicators and signals:
Entry line: Shows where the buy or sell signal is triggered.
Take profit and stop loss levels are plotted as lines.
EMA and Supertrend lines are plotted on the chart.
Trailing stop line, if enabled, is also plotted.
8. Buy and Sell Labels:
The script places labels on the chart when buy or sell signals are triggered, indicating the price at which the order should be placed.
9. Exit Line:
The script plots an exit line when the trailing stop is hit, signaling when a position should be closed.
10. Alerts:
Alerts are set for both buy and sell signals, notifying the trader when to act based on the strategy's conditions.
This strategy combines trend-following (Supertrend), momentum (RSI), and price action patterns (EMA crossovers and engulfing candlestick patterns) to generate trade signals. It also offers the flexibility of take profit, stop loss, and trailing stop features.

Liquidity Heatmap SwiftEdgeDescription
Liquidity Heatmap with Buy/Sell Side (Blue/Red) is a technical analysis tool designed to help traders identify potential liquidity zones in the market by combining swing high/low detection with volume analysis, visualized as a heatmap overlay on the chart. This script highlights areas where significant buying or selling pressure may exist, often acting as support or resistance levels, and provides a clear visual representation of these zones using color-coded heatmap boxes and labeled bubbles.
What It Does
The script identifies key price levels (swing highs and lows) where liquidity is likely to be concentrated, such as stop-loss clusters or pending orders. These levels are then grouped into a heatmap, with blue zones representing potential buy-side liquidity (below the current price) and red zones indicating sell-side liquidity (above the current price). Each zone is marked with a bubble showing the estimated liquidity amount, derived from volume data, to help traders gauge the strength of the level.
How It Works
The script combines three main components to create a comprehensive liquidity visualization:
Swing Highs and Lows Detection:
The script uses the ta.pivothigh and ta.pivotlow functions to identify swing highs and lows over a user-defined lookback period (Swing Length). These levels often represent areas where price has reversed, indicating potential liquidity zones where stop-losses or pending orders may be placed.
Volume Analysis:
Volume data at each swing high/low is captured and averaged over a specified period (Volume Average Length). This volume is then scaled using a multiplier (Volume Multiplier for Liquidity) to estimate the liquidity amount at each level, displayed in thousands (e.g., "10K") on the chart via labeled bubbles.
Heatmap Visualization:
The identified levels are grouped into price bins to form a heatmap. The price range is divided into a user-defined number of bins (Number of Heatmap Bins), and each bin is drawn as a colored box (blue for buy-side, red for sell-side). The transparency of the heatmap boxes can be adjusted (Heatmap Transparency) to ensure they do not obscure the price action.
Why Combine These Components?
The combination of swing highs/lows, volume analysis, and a heatmap provides a powerful way to visualize liquidity in the market. Swing highs and lows are natural points where liquidity tends to accumulate, as they often coincide with areas where traders place stop-losses or pending orders. By incorporating volume data, the script quantifies the potential strength of these levels, giving traders insight into the magnitude of liquidity present. The heatmap visualization then aggregates these levels into a clear, color-coded overlay, making it easy to see where buy-side and sell-side liquidity is concentrated without cluttering the chart.
This mashup is particularly useful because it bridges price action (swing levels), market activity (volume), and visual clarity (heatmap), offering a holistic view of potential support and resistance zones that might influence price movements.
How to Use It
Add the Indicator to Your Chart:
Apply the script to your chart by adding it from the Pine Script library. It will overlay directly on your price chart.
Interpret the Heatmap:
Blue Zones (Buy-Side Liquidity): These appear below the current price and indicate levels where buying pressure or stop-losses from short positions may be located.
Red Zones (Sell-Side Liquidity): These appear above the current price and indicate levels where selling pressure or stop-losses from long positions may be located.
The intensity of the color is controlled by the Heatmap Transparency setting—lower values make the zones more opaque, while higher values make them more transparent.
Analyze the Bubbles:
Each liquidity zone is marked with a bubble showing the estimated liquidity amount in thousands (e.g., "10K"). The size of the bubble is scaled by the Bubble Size Multiplier, with larger bubbles indicating higher liquidity.
Adjust Settings for Your Needs:
Liquidity Settings:
Swing Length: Controls the lookback period for detecting swing highs and lows. A smaller value (e.g., 10) is better for shorter timeframes like 1-minute charts, while a larger value (e.g., 50) suits higher timeframes.
Liquidity Threshold: Defines how close two levels must be to be considered the same, preventing duplicate zones.
Volume Average Length: Sets the period for averaging volume data at swing points.
Volume Multiplier for Liquidity: Scales the volume to estimate liquidity amounts shown in the bubbles.
Lookback Period (Hours): Limits how far back the script looks for liquidity zones.
Use Price Window Filter: If enabled, only shows zones within a price range defined by Liquidity Window (Points per Side).
Heatmap Settings:
Number of Heatmap Bins: Determines how many price bins the heatmap is divided into. More bins create a finer resolution but may clutter the chart.
Heatmap Bin Height (Points): Sets the vertical height of each heatmap box in price points.
Heatmap Transparency: Adjusts the transparency of the heatmap boxes (0 = fully opaque, 100 = fully transparent).
Display Settings:
Bubble Size Multiplier: Scales the size of the bubbles showing liquidity amounts.
Trading Application:
Use the heatmap to identify potential support (blue zones) and resistance (red zones) levels where price may react.
Pay attention to zones with larger bubbles, as they indicate higher liquidity and may have a stronger impact on price.
Combine with other analysis tools (e.g., trendlines, indicators) to confirm trade setups.
What Makes It Original?
This script stands out by integrating swing high/low detection with volume-based liquidity estimation and a heatmap visualization in a single tool. Unlike traditional support/resistance indicators that only plot static lines, this script dynamically aggregates liquidity zones into a heatmap, making it easier to see clusters of potential buying or selling pressure. The addition of volume-derived liquidity amounts in labeled bubbles provides a unique quantitative measure of each zone's strength, helping traders prioritize key levels. The color-coded buy/sell distinction further enhances its utility by visually separating zones based on their likely market impact.
Example Use Case
On a 1-minute chart of EUR/USD, you might set Swing Length to 10 to capture short-term pivots, Lookback Period (Hours) to 4 to focus on recent data, and Liquidity Window to 200 points (20 pips) to show only nearby zones. The heatmap will then display blue zones below the current price where buy-side liquidity may act as support, and red zones above where sell-side liquidity may act as resistance. A bubble showing "50K" at a blue zone indicates significant buy-side liquidity, suggesting a potential bounce if the price approaches that level.

FlexATRFlexATR: A Dynamic Multi-Timeframe Trading Strategy
Overview: FlexATR is a versatile trading strategy that dynamically adapts its key parameters based on the timeframe being used. It combines technical signals from exponential moving averages (EMAs) and the Relative Strength Index (RSI) with volatility-based risk management via the Average True Range (ATR). This approach helps filter out false signals while adjusting to varying market conditions — whether you’re trading on a daily chart, intraday charts (30m, 60m, or 5m), or even on higher timeframes like the 4-hour or weekly charts.
How It Works:
Multi-Timeframe Parameter Adaptation: FlexATR is designed to automatically adjust its indicator settings depending on the timeframe:
Daily and Weekly: On higher timeframes, the strategy uses longer periods for the fast and slow EMAs and standard periods for RSI and ATR to capture more meaningful trend confirmations while minimizing noise.
Intraday (e.g., 30m, 60m, 5m, 4h): The parameters are converted from “days” into the corresponding number of bars. For instance, on a 30-minute chart, a “day” might equal 48 bars. The preset values for a 30-minute chart have been slightly reduced (e.g., a fast EMA is set at 0.35 days instead of 0.4) to improve reactivity while maintaining robust filtering.
Signal Generation:
Entry Signals: The strategy enters long positions when the fast EMA crosses above the slow EMA and the RSI is above 50, and it enters short positions when the fast EMA crosses below the slow EMA with the RSI below 50. This dual confirmation helps ensure that signals are reliable.
Risk Management: The ATR is used to compute dynamic levels for stop loss and profit target:
Stop Loss: For a long position, the stop loss is placed at Price - (ATR × Stop Loss Multiplier). For a short position, it is at Price + (ATR × Stop Loss Multiplier).
Profit Target: The profit target is similarly set using the ATR multiplied by a designated profit multiplier.
Dynamic Trailing Stop: FlexATR further incorporates a dynamic trailing stop (if enabled) that adjusts according to the ATR. This trailing stop follows favorable price movements at a distance defined by a multiplier, locking in gains as the trend develops. The use of a trailing stop helps protect profits without requiring a fixed exit point.
Capital Allocation: Each trade is sized at 10% of the total equity. This percentage-based position sizing allows the strategy to scale with your account size. While the current setup assumes no leverage (a 1:1 exposure), the inherent design of the strategy means you can adjust the leverage externally if desired, with risk metrics scaling accordingly.
Visual Representation: For clarity and accessibility (especially for those with color vision deficiencies), FlexATR employs a color-blind friendly palette (the Okabe-Ito palette):
EMA Fast: Displayed in blue.
EMA Slow: Displayed in orange.
Stop Loss Levels: Rendered in vermilion.
Profit Target Levels: Shown in a distinct azzurro (light blue).
Benefits and Considerations:
Reliability: By requiring both EMA crossovers and an RSI confirmation, FlexATR filters out a significant amount of market noise, which reduces false signals at the expense of some delayed entries.
Adaptability: The automatic conversion of “day-based” parameters into bar counts for intraday charts means the strategy remains consistent across different timeframes.
Risk Management: Using the ATR for both fixed and trailing stops allows the strategy to adapt to changing market volatility, helping to protect your capital.
Flexibility: The strategy’s inputs are customizable via the input panel, allowing traders to fine-tune the parameters for different assets or market conditions.
Conclusion: FlexATR is designed as a balanced, adaptive strategy that emphasizes reliability and robust risk management across a variety of timeframes. While it may sometimes enter trades slightly later due to its filtering mechanism, its focus on confirming trends helps reduce the likelihood of false signals. This makes it particularly attractive for traders who prioritize a disciplined, multi-timeframe approach to capturing market trends.
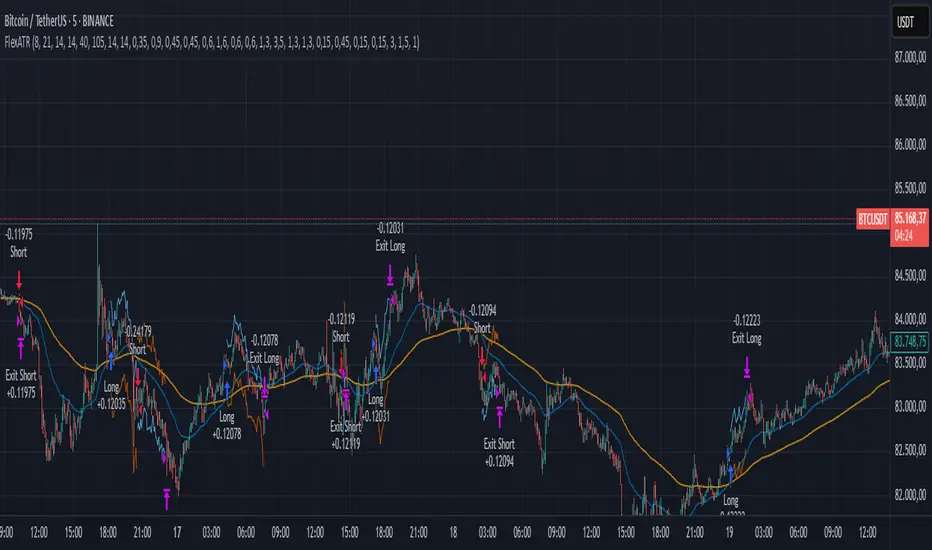
Dynamic Timeframe Trend AnalyzerPurpose and Core Logic
This indicator automatically adjusts its calculations based on the current chart’s timeframe, allowing traders to analyze trends, momentum, and mean reversion opportunities without manually changing indicator settings for each interval. It detects potential long or short setups by combining several techniques:
Dynamic Timeframe Factor
The script compares the current timeframe to a base (e.g., 5 minutes) and calculates a “factor” to scale certain parameters, such as EMA lengths or ATR settings. This reduces the need to reconfigure indicators when switching timeframes.
Regime Detection
It uses ADX (Average Directional Index) to classify the market as strongly trending, moderately trending, choppy, or in a potential mean-reversion phase.
RSI (Relative Strength Index) is also monitored for extreme levels (e.g., overbought/oversold) to detect potential reversal zones.
Volume is compared to a moving average to confirm or refute volatility conditions.
Trend & Mean Reversion Signals
EMA Alignment (8/21/55) helps identify bullish or bearish phases (strong bull if all EMAs align upward, strong bear if aligned downward).
For mean reversion opportunities, the script checks if ADX is sufficiently low (indicating weak or no trend) while price and RSI are at extreme levels—suggesting a snapback or countertrend move may occur.
Dynamic Stop Loss & Take Profit
Uses ATR (Average True Range) to set initial stop-loss (SL) and take-profit (TP) levels, then adjusts these levels further with “regime multipliers” based on whether the market is in a high-volatility trend or a quieter mean-reversion environment.
This approach aims to place stops and targets in a more adaptive way, reflecting current market conditions rather than a one-size-fits-all approach.
Visual Aids
Color-coded chart backgrounds (e.g., greenish for bullish trend, red for bearish, yellow/orange for mean reversion).
Triangles to show recent bullish/bearish signals.
A status table in the top-right corner (optional) displaying key metrics like ADX, RSI, dynamic thresholds, current SL/TP levels, and whether a stop loss has been hit.
How It Works Internally
ADX & Dynamic Thresholds:
A moving average (adx_mean) and standard deviation (adx_std) of the ADX are calculated over a lookback period to define “strong” vs. “weak” ADX thresholds.
This allows the script to adapt to changing volatility and trend strength in different markets or timeframes.
Mean Reversion Criteria:
The indicator checks if price deviates significantly from its own moving average, alongside RSI extremes. If ADX suggests no strong directional push (i.e., the market is “quiet”), it may classify conditions as mean-reverting.
Regime Multipliers:
Once the script identifies the market regime (e.g., strong uptrend, choppy, mean reversion), it applies different multipliers to the user-defined base values for stop-loss and take-profit. For instance, strong trending conditions might allow for wider stops to handle volatility, while mean reversion signals use tighter exits to capture quick reversals.
How to Use It
Timeframe Agnostic
Simply apply it to any timeframe (from 1-minute up to daily or weekly). The “Dynamic Timeframe Factor” will scale the indicator parameters automatically.
Look for Buy/Sell Triangles
When the script detects a valid bullish trend shift or a mean-reversion long setup, it plots a green triangle under the price bar. Conversely, it plots a red triangle above the price bar for bearish or mean-reversion short setups.
Check the Status Table
The table in the top-right corner summarizes the indicator’s current readings: ADX, RSI, volume trends, and the market regime classification.
The table also shows if a stop loss has been hit (SL Hit) and displays recommended SL/TP levels if a signal is active.
Stop Loss & Take Profit
The script plots lines for SL and TP on your chart after a new signal. These lines are automatically adjusted based on ATR, volume conditions, and ADX-derived multipliers.
Mean Reversion vs. Trend-Following
If you see a “Mean Rev” state in the table or the background turning yellow/orange, it suggests potential countertrend trades. Conversely, “STRONG BULL” or “STRONG BEAR” states favor momentum-based entries in the prevailing direction.
Originality & Benefits
Adaptive to Timeframe: Many indicators require reconfiguration when switching from short to long timeframes. This script automates that process using the “timeframe factor” logic.
Regime-Based SL/TP: Instead of fixed risk parameters, the script dynamically tunes stop and target levels depending on whether the market is trending or reverting.
Comprehensive Market View: It combines multiple factors—ADX, RSI, volume, moving averages, and volatility measurements—into a single, integrated framework that categorizes the market regime in real time.
Best Practices & Notes
Timeframes: It typically performs well on intraday timeframes (5m, 15m, 1H) but can also be used for swing trading on 4H or Daily charts.
Settings: The defaults are a good starting point, but you can adjust the base ATR multiplier or ADX lookbacks if you prefer a different balance between sensitivity and stability.
Risk Management: This indicator is not a guarantee of any specific results. Always use proper risk management (position sizing, stop-losses, and diversified strategies).
Alert Conditions: Built-in alert conditions can notify you when a new long or short signal appears, or when a stop loss is triggered.
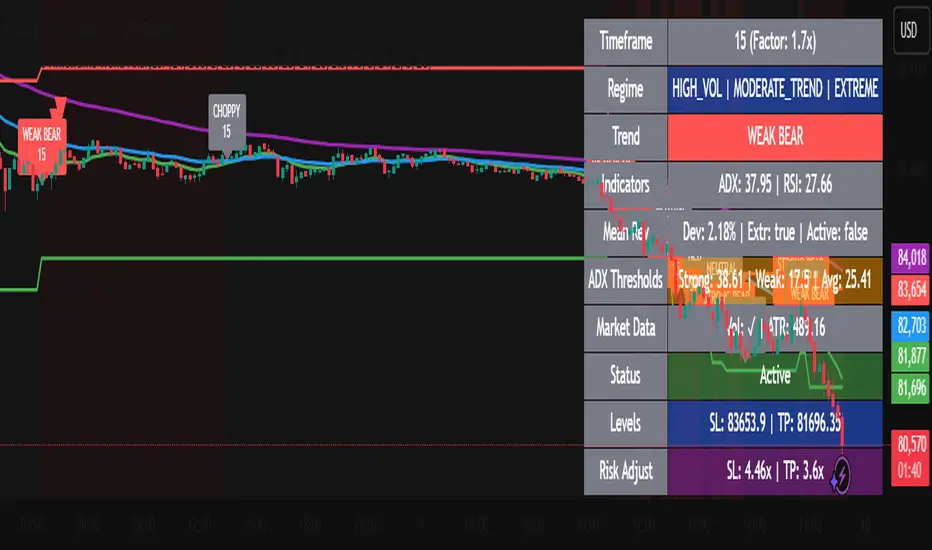
Strategy SuperTrend SDI WebhookThis Pine Script™ strategy is designed for automated trading in TradingView. It combines the SuperTrend indicator and Smoothed Directional Indicator (SDI) to generate buy and sell signals, with additional risk management features like stop loss, take profit, and trailing stop. The script also includes settings for leverage trading, equity-based position sizing, and webhook integration.
Key Features
1. Date-based Trade Execution
The strategy is active only between the start and end dates set by the user.
times ensures that trades occur only within this predefined time range.
2. Position Sizing and Leverage
Uses leverage trading to adjust position size dynamically based on initial equity.
The user can set leverage (leverage) and percentage of equity (usdprcnt).
The position size is calculated dynamically (initial_capital) based on account performance.
3. Take Profit, Stop Loss, and Trailing Stop
Take Profit (tp): Defines the target profit percentage.
Stop Loss (sl): Defines the maximum allowable loss per trade.
Trailing Stop (tr): Adjusts dynamically based on trade performance to lock in profits.
4. SuperTrend Indicator
SuperTrend (ta.supertrend) is used to determine the market trend.
If the price is above the SuperTrend line, it indicates an uptrend (bullish).
If the price is below the SuperTrend line, it signals a downtrend (bearish).
Plots visual indicators (green/red lines and circles) to show trend changes.
5. Smoothed Directional Indicator (SDI)
SDI helps to identify trend strength and momentum.
It calculates +DI (bullish strength) and -DI (bearish strength).
If +DI is higher than -DI, the market is considered bullish.
If -DI is higher than +DI, the market is considered bearish.
The background color changes based on the SDI signal.
6. Buy & Sell Conditions
Long Entry (Buy) Conditions:
SDI confirms an uptrend (+DI > -DI).
SuperTrend confirms an uptrend (price crosses above the SuperTrend line).
Short Entry (Sell) Conditions:
SDI confirms a downtrend (+DI < -DI).
SuperTrend confirms a downtrend (price crosses below the SuperTrend line).
Optionally, trades can be filtered using crossovers (occrs option).
7. Trade Execution and Exits
Market entries:
Long (strategy.entry("Long")) when conditions match.
Short (strategy.entry("Short")) when bearish conditions are met.
Trade exits:
Uses predefined take profit, stop loss, and trailing stop levels.
Positions are closed if the strategy is out of the valid time range.
Usage
Automated Trading Strategy:
Can be integrated with webhooks for automated execution on supported trading platforms.
Trend-Following Strategy:
Uses SuperTrend & SDI to identify trend direction and strength.
Risk-Managed Leverage Trading:
Supports position sizing, stop losses, and trailing stops.
Backtesting & Optimization:
Can be used for historical performance analysis before deploying live.
Conclusion
This strategy is suitable for traders who want to automate their trading using SuperTrend and SDI indicators. It incorporates risk management tools like stop loss, take profit, and trailing stop, making it adaptable for leverage trading. Traders can customize settings, conduct backtests, and integrate it with webhooks for real-time trade execution. 🚀
Important Note:
This script is provided for educational and template purposes and does not constitute financial advice. Traders and investors should conduct their research and analysis before making any trading decisions.

EMA 5 Alert Candle ShortThe 5 EMA (Exponential Moving Average) Strategy is a simple yet effective trading strategy that helps traders identify short-term trends and potential entry and exit points. This strategy is widely used in intraday and swing trading, particularly in forex, stocks, and crypto markets.
Components of the 5 EMA Strategy
5 EMA: A fast-moving average that reacts quickly to price movements.
15-minute or 1-hour timeframe (commonly used, but adaptable to other timeframes).
Candlestick Patterns: To confirm entry signals.
How the 5 EMA Strategy Works
Buy (Long) Setup:
Price Above the 5 EMA: The price should be trading above the 5 EMA.
Pullback to the 5 EMA: A minor retracement or consolidation near the 5 EMA.
Bullish Candlestick Confirmation: A bullish candle (e.g., engulfing or pin bar) forms near the 5 EMA.
Entry: Enter a long trade at the close of the bullish candle.
Stop Loss: Place below the recent swing low or 5-10 pips below the 5 EMA.
Take Profit: Aim for a risk-reward ratio of at least 1:2 or trail the stop using a higher EMA (e.g., 10 or 20 EMA).
Sell (Short) Setup:
Price Below the 5 EMA: The price should be trading below the 5 EMA.
Pullback to the 5 EMA: A small retracement towards the 5 EMA.
Bearish Candlestick Confirmation: A bearish candle (e.g., engulfing or pin bar) near the 5 EMA.
Entry: Enter a short trade at the close of the bearish candle.
Stop Loss: Place above the recent swing high or 5-10 pips above the 5 EMA.
Take Profit: Aim for a 1:2 risk-reward ratio or use a trailing stop.
Additional Filters for Better Accuracy
Higher Timeframe Confirmation: Check the trend on a higher timeframe (e.g., 1-hour or 4-hour).
Volume Confirmation: Enter trades when volume is increasing.
Avoid Sideways Market: Use the strategy only when the market is trending.
Advantages of the 5 EMA Strategy
✔️ Simple and easy to use.
✔️ Works well in trending markets.
✔️ Helps traders capture short-term momentum.
Disadvantages
❌ Less effective in choppy or sideways markets.
❌ Requires discipline in following stop-loss rules.

AO/AC Trading Zones Strategy [Skyrexio] Overview
AO/AC Trading Zones Strategy leverages the combination of Awesome Oscillator (AO), Acceleration/Deceleration Indicator (AC), Williams Fractals, Williams Alligator and Exponential Moving Average (EMA) to obtain the high probability long setups. Moreover, strategy uses multi trades system, adding funds to long position if it considered that current trend has likely became stronger. Combination of AO and AC is used for creating so-called trading zones to create the signals, while Alligator and Fractal are used in conjunction as an approximation of short-term trend to filter them. At the same time EMA (default EMA's period = 100) is used as high probability long-term trend filter to open long trades only if it considers current price action as an uptrend. More information in "Methodology" and "Justification of Methodology" paragraphs. The strategy opens only long trades.
Unique Features
No fixed stop-loss and take profit: Instead of fixed stop-loss level strategy utilizes technical condition obtained by Fractals and Alligator to identify when current uptrend is likely to be over. In some special cases strategy uses AO and AC combination to trail profit (more information in "Methodology" and "Justification of Methodology" paragraphs)
Configurable Trading Periods: Users can tailor the strategy to specific market windows, adapting to different market conditions.
Multilayer trades opening system: strategy uses only 10% of capital in every trade and open up to 5 trades at the same time if script consider current trend as strong one.
Short and long term trend trade filters: strategy uses EMA as high probability long-term trend filter and Alligator and Fractal combination as a short-term one.
Methodology
The strategy opens long trade when the following price met the conditions:
1. Price closed above EMA (by default, period = 100). Crossover is not obligatory.
2. Combination of Alligator and Williams Fractals shall consider current trend as an upward (all details in "Justification of Methodology" paragraph)
3. Both AC and AO shall print two consecutive increasing values. At the price candle close which corresponds to this condition algorithm opens the first long trade with 10% of capital.
4. If combination of Alligator and Williams Fractals shall consider current trend has been changed from up to downtrend, all long trades will be closed, no matter how many trades has been opened.
5. If AO and AC both continue printing the rising values strategy opens the long trade on each candle close with 10% of capital while number of opened trades reaches 5.
6. If AO and AC both has printed 5 rising values in a row algorithm close all trades if candle's low below the low of the 5-th candle with rising AO and AC values in a row.
Script also has additional visuals. If second long trade has been opened simultaneously the Alligator's teeth line is plotted with the green color. Also for every trade in a row from 2 to 5 the label "Buy More" is also plotted just below the teeth line. With every next simultaneously opened trade the green color of the space between teeth and price became less transparent.
Strategy settings
In the inputs window user can setup strategy setting:
EMA Length (by default = 100, period of EMA, used for long-term trend filtering EMA calculation).
User can choose the optimal parameters during backtesting on certain price chart.
Justification of Methodology
Let's explore the key concepts of this strategy and understand how they work together. We'll begin with the simplest: the EMA.
The Exponential Moving Average (EMA) is a type of moving average that assigns greater weight to recent price data, making it more responsive to current market changes compared to the Simple Moving Average (SMA). This tool is widely used in technical analysis to identify trends and generate buy or sell signals. The EMA is calculated as follows:
1.Calculate the Smoothing Multiplier:
Multiplier = 2 / (n + 1), Where n is the number of periods.
2. EMA Calculation
EMA = (Current Price) × Multiplier + (Previous EMA) × (1 − Multiplier)
In this strategy, the EMA acts as a long-term trend filter. For instance, long trades are considered only when the price closes above the EMA (default: 100-period). This increases the likelihood of entering trades aligned with the prevailing trend.
Next, let’s discuss the short-term trend filter, which combines the Williams Alligator and Williams Fractals. Williams Alligator
Developed by Bill Williams, the Alligator is a technical indicator that identifies trends and potential market reversals. It consists of three smoothed moving averages:
Jaw (Blue Line): The slowest of the three, based on a 13-period smoothed moving average shifted 8 bars ahead.
Teeth (Red Line): The medium-speed line, derived from an 8-period smoothed moving average shifted 5 bars forward.
Lips (Green Line): The fastest line, calculated using a 5-period smoothed moving average shifted 3 bars forward.
When the lines diverge and align in order, the "Alligator" is "awake," signaling a strong trend. When the lines overlap or intertwine, the "Alligator" is "asleep," indicating a range-bound or sideways market. This indicator helps traders determine when to enter or avoid trades.
Fractals, another tool by Bill Williams, help identify potential reversal points on a price chart. A fractal forms over at least five consecutive bars, with the middle bar showing either:
Up Fractal: Occurs when the middle bar has a higher high than the two preceding and two following bars, suggesting a potential downward reversal.
Down Fractal: Happens when the middle bar shows a lower low than the surrounding two bars, hinting at a possible upward reversal.
Traders often use fractals alongside other indicators to confirm trends or reversals, enhancing decision-making accuracy.
How do these tools work together in this strategy? Let’s consider an example of an uptrend.
When the price breaks above an up fractal, it signals a potential bullish trend. This occurs because the up fractal represents a shift in market behavior, where a temporary high was formed due to selling pressure. If the price revisits this level and breaks through, it suggests the market sentiment has turned bullish.
The breakout must occur above the Alligator’s teeth line to confirm the trend. A breakout below the teeth is considered invalid, and the downtrend might still persist. Conversely, in a downtrend, the same logic applies with down fractals.
In this strategy if the most recent up fractal breakout occurs above the Alligator's teeth and follows the last down fractal breakout below the teeth, the algorithm identifies an uptrend. Long trades can be opened during this phase if a signal aligns. If the price breaks a down fractal below the teeth line during an uptrend, the strategy assumes the uptrend has ended and closes all open long trades.
By combining the EMA as a long-term trend filter with the Alligator and fractals as short-term filters, this approach increases the likelihood of opening profitable trades while staying aligned with market dynamics.
Now let's talk about the trading zones concept and its signals. To understand this we need to briefly introduce what is AO and AC. The Awesome Oscillator (AO), developed by Bill Williams, is a momentum indicator designed to measure market momentum by contrasting recent price movements with a longer-term historical perspective. It helps traders detect potential trend reversals and assess the strength of ongoing trends.
The formula for AO is as follows:
AO = SMA5(Median Price) − SMA34(Median Price)
where:
Median Price = (High + Low) / 2
SMA5 = 5-period Simple Moving Average of the Median Price
SMA 34 = 34-period Simple Moving Average of the Median Price
The Acceleration/Deceleration (AC) Indicator, introduced by Bill Williams, measures the rate of change in market momentum. It highlights shifts in the driving force of price movements and helps traders spot early signs of trend changes. The AC Indicator is particularly useful for identifying whether the current momentum is accelerating or decelerating, which can indicate potential reversals or continuations. For AC calculation we shall use the AO calculated above is the following formula:
AC = AO − SMA5(AO) , where SMA5(AO)is the 5-period Simple Moving Average of the Awesome Oscillator
When the AC is above the zero line and rising, it suggests accelerating upward momentum.
When the AC is below the zero line and falling, it indicates accelerating downward momentum.
When the AC is below zero line and rising it suggests the decelerating the downtrend momentum. When AC is above the zero line and falling, it suggests the decelerating the uptrend momentum.
Now let's discuss the trading zones concept and how it can create the signal. Zones are created by the combination of AO and AC. We can divide three zone types:
Greed zone: when the AO and AC both are rising
Red zone: when the AO and AC both are decreasing
Gray zone: when one of AO or AC is rising, the other is falling
Gray zone is considered as uncertainty. AC and AO are moving in the opposite direction. Strategy skip such price action to decrease the chance to stuck in the losing trade during potential sideways. Red zone is also not interesting for the algorithm because both indicators consider the trend as bearish, but strategy opens only long trades. It is waiting for the green zone to increase the chance to open trade in the direction of the potential uptrend. When we have 2 candles in a row in the green zone script executes a long trade with 10% of capital.
Two green zone candles in a row is considered by algorithm as a bullish trend, but now so strong, that's the reason why trade is going to be closed when the combination of Alligator and Fractals will consider the the trend change from bullish to bearish. If id did not happens, algorithm starts to count the green zone candles in a row. When we have 5 in a row script change the trade closing condition. Such situation is considered is a high probability strong bull market and all trades will be closed if candle's low will be lower than fifth green zone candle's low. This is used to increase probability to secure the profit. If long trades are initiated, the strategy continues utilizing subsequent signals until the total number of trades reaches a maximum of 5. Each trade uses 10% of capital.
Why we use trading zones signals? If currently strategy algorithm considers the high probability of the short-term uptrend with the Alligator and Fractals combination pointed out above and the long-term trend is also suggested by the EMA filter as bullish. Rising AC and AO values in the direction of the most likely main trend signaling that we have the high probability of the fastest bullish phase on the market. The main idea is to take part in such rapid moves and add trades if this move continues its acceleration according to indicators.
Backtest Results
Operating window: Date range of backtests is 2023.01.01 - 2024.12.31. It is chosen to let the strategy to close all opened positions.
Commission and Slippage: Includes a standard Binance commission of 0.1% and accounts for possible slippage over 5 ticks.
Initial capital: 10000 USDT
Percent of capital used in every trade: 10%
Maximum Single Position Loss: -9.49%
Maximum Single Profit: +24.33%
Net Profit: +4374.70 USDT (+43.75%)
Total Trades: 278 (39.57% win rate)
Profit Factor: 2.203
Maximum Accumulated Loss: 668.16 USDT (-5.43%)
Average Profit per Trade: 15.74 USDT (+1.37%)
Average Trade Duration: 60 hours
How to Use
Add the script to favorites for easy access.
Apply to the desired timeframe and chart (optimal performance observed on 4h BTC/USDT).
Configure settings using the dropdown choice list in the built-in menu.
Set up alerts to automate strategy positions through web hook with the text: {{strategy.order.alert_message}}
Disclaimer:
Educational and informational tool reflecting Skyrex commitment to informed trading. Past performance does not guarantee future results. Test strategies in a simulated environment before live implementation
These results are obtained with realistic parameters representing trading conditions observed at major exchanges such as Binance and with realistic trading portfolio usage parameters.

CCI Buy and Sell Signals with 20/30 EMACCI Buy and Sell Signals with EMA and ATR Stop Loss/Take Profit
This indicator is designed to identify buy and sell signals based on a combination of the Commodity Channel Index (CCI) and Exponential Moving Averages (EMA). It also includes an optional ATR-based stop loss and take profit system, which is useful for traders who want to manage their trades with dynamic risk levels.
Features:
CCI Buy and Sell Signals:
Buy Signal: A buy signal is triggered when the CCI crosses up through -100 (from an oversold condition), the 20-period EMA is above the 30-period EMA, and the price is above the 200-period EMA. This suggests that the market is entering an upward trend.
Sell Signal: A sell signal is triggered when the CCI crosses down through +100 (from an overbought condition), the 20-period EMA is below the 30-period EMA, and the price is below the 200-period EMA. This suggests that the market is entering a downward trend.
Exponential Moving Averages (EMA):
The script plots three EMAs:
20-period EMA (Green): Used to identify short-term trends.
30-period EMA (Red): Used to capture medium-term trends.
200-period EMA (Orange): A long-term trend filter, with the price above it generally indicating bullish conditions and below it indicating bearish conditions.
ATR-Based Stop Loss and Take Profit:
Optional Feature: The ATR (Average True Range) indicator can be used to set stop loss and take profit levels based on market volatility.
Stop Loss: Set at a multiple of the ATR below the entry price for long positions and above the entry price for short positions.
Take Profit: Set at a multiple of the ATR above the entry price for long positions and below the entry price for short positions.
Customizable: You can adjust the ATR length, Stop Loss Multiplier, and Take Profit Multiplier through the settings.
Dots: The stop loss and take profit levels are plotted as dots on the chart when the ATR feature is enabled.
Alert Conditions:
Buy Signal Alert: Triggered when a buy signal occurs based on CCI crossing up -100 and other conditions being met.
Sell Signal Alert: Triggered when a sell signal occurs based on CCI crossing down +100 and other conditions being met.
Any Signal Alert: This is a combined alert that triggers for either a buy or sell signal. It helps you stay updated on both types of signals simultaneously.
How to Use:
The indicator will plot buy and sell arrows on the chart, giving clear entry points for trades based on CCI and EMA conditions.
The ATR stop loss and take profit dots (when enabled) provide automatic risk management levels, adjusting dynamically with market volatility.
Traders can customize the ATR settings to fine-tune their stop loss and take profit levels, making this strategy adaptable to different trading styles and market conditions.
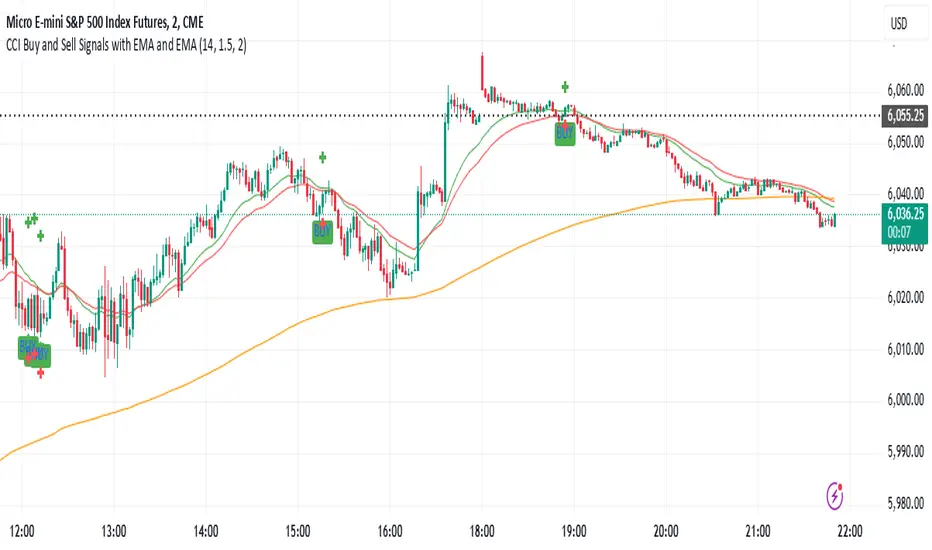
IU Range Trading StrategyIU Range Trading Strategy
The IU Range Trading Strategy is designed to identify range-bound markets and take trades based on defined price ranges. This strategy uses a combination of price ranges and ATR (Average True Range) to filter entry conditions and incorporates a trailing stop-loss mechanism for better trade management.
User Inputs:
- Range Length: Defines the number of bars to calculate the highest and lowest price range (default: 10).
- ATR Length: Sets the length of the ATR calculation (default: 14).
- ATR Stop-Loss Factor: Determines the multiplier for the ATR-based stop-loss (default: 2.00).
Entry Conditions:
1. A range is identified when the difference between the highest and lowest prices over the selected range is less than or equal to 1.75 times the ATR.
2. Once a valid range is formed:
- A long trade is triggered at the range high.
- A short trade is triggered at the range low.
Exit Conditions:
1. Trailing Stop-Loss:
- The stop-loss adjusts dynamically using ATR targets.
- The strategy locks in profits as the trade moves in your favor.
2. The stop-loss and take-profit levels are visually plotted for transparency and easier decision-making.
Features:
- Automated box creation to visualize the trading range.
- Supports one position at a time, canceling opposite-side entries.
- ATR-based trailing stop-loss for effective risk management.
- Clear visual representation of stop-loss and take-profit levels with colored bands.
This strategy works best in markets with defined ranges and can help traders identify breakout opportunities when the price exits the range.
